Food Waste Measurement, Monitoring and Reduction Programme
Food Waste Measurement, Monitoring and Reduction Programme
Termiz State Pedagogical Institute
An institution-wide framework for measuring, monitoring and reducing food waste generated by campus food-service activities through source separation, direct weighing, outlet-level recording, monthly consolidation and evidence-based operational improvement.
SDG 12 – Responsible Consumption and Production1. Programme Purpose and Institutional Approach
Termiz State Pedagogical Institute operates an institution-wide approach to the measurement, monitoring and reduction of food waste generated by campus food-service activities.
The system combines source separation, weighing, outlet-level recording, monthly consolidation and operational follow-up in order to produce reliable management information and reduce avoidable food waste.
The monitoring framework has been expanded to cover five identified food-service points. This broadens the previous monitoring scope and establishes a single measurement procedure for all campus food-service activities, including food-service points managed by external operators where applicable.
2. Development of the Monitoring System
| Area | Previous Practice | Current Institutional Approach |
|---|---|---|
| Monitoring scope | Four dining points described in earlier material | Five identified food-service points included |
| Measurement basis | Aggregate and estimated calculations | Outlet-level weighing in kilograms prioritised |
| Recording | Regular recording described | Daily outlet log with responsible-person confirmation |
| Consolidation | General monitoring | Monthly outlet summaries and institutional consolidation |
| Data quality | Estimated per-student values used for planning | Measured values used for operational records; estimates kept separate |
| Operational response | Awareness and waste-management activities | Measurement results linked to portion, menu and awareness follow-up |
3. Food-Service Points Covered
Five identified food-service points are included in the institutional food-waste monitoring framework.
| No. | Food-Service Point | Indicative Share of Daily Food-Service Demand | Monitoring Status |
|---|---|---|---|
| 1 | Master Food | 30% | Included |
| 2 | Milliy taomlar | 22% | Included |
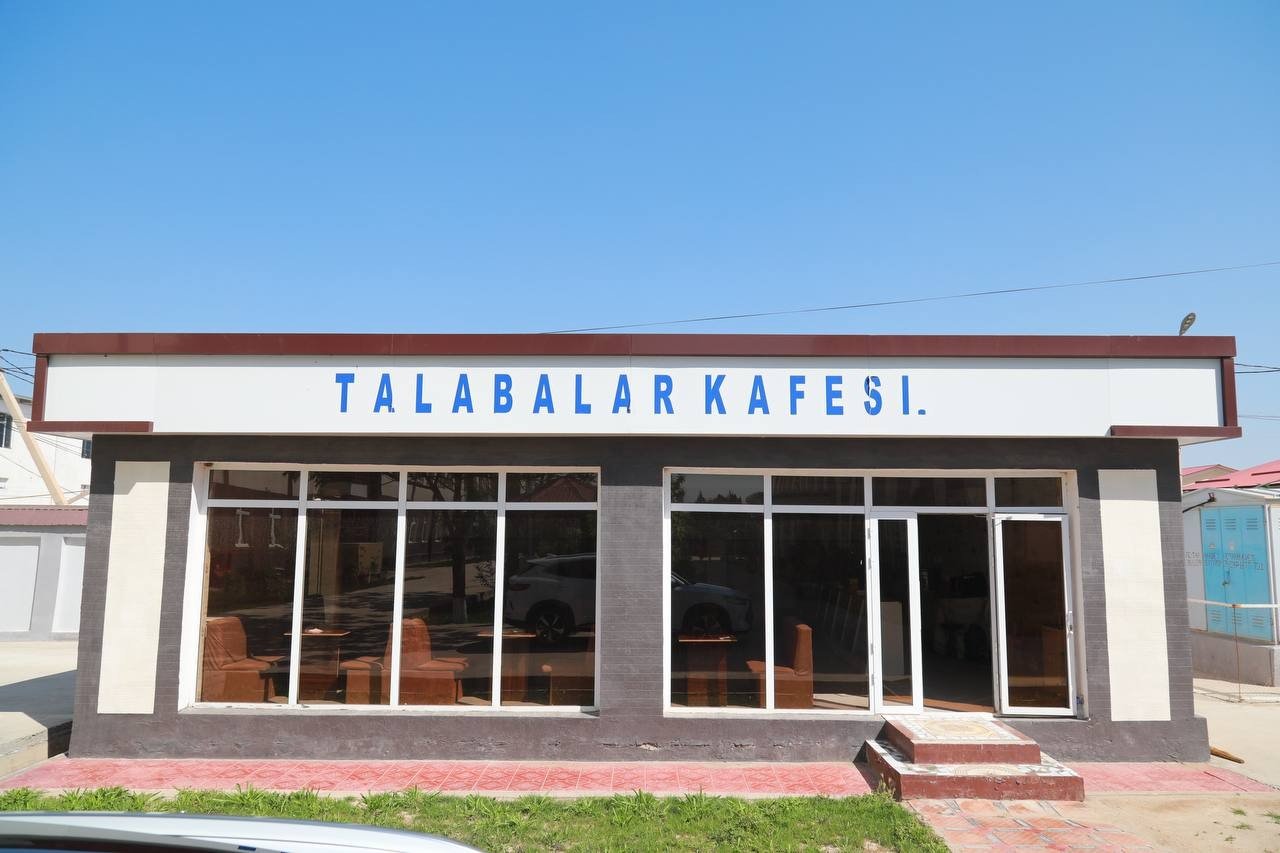
| 3 | Talabalar kafesi | 20% | Included |
| 4 | Student Cafe | 15% | Included |
| 5 | NUR Restaurant | 13% | Included |
| TOTAL | 100% | 5 of 5 | |
Photographic Documentation of Campus Food-Service Facilities


Figure 1. Selected photographic views of food-service facilities included in the institutional food-waste monitoring system.
The photographic record documents the Institute's operating food-service environment and supports the outlet register used for food-waste monitoring.
Exterior and interior views, where available, are retained together with outlet-level measurement records to maintain traceability between food-service points and monitoring activities.
Indicative Distribution of Food-Service Demand
4. Indicative Planning Baseline
For internal planning, an indicative baseline is used to estimate the expected scale of food-waste monitoring before a complete series of measured outlet records is available.
This planning model is not a substitute for measured data. Its purpose is to support staffing, container capacity, weighing arrangements and reduction targets.
The model uses a planning population of 11,250 students, a 35% indicative daily participation rate in campus food-service, and an indicative food-waste factor of 75 grams per served meal.
| Planning Parameter | Indicative Value |
|---|---|
| Planning student population | 11,250 |
| Indicative daily food-service participation | 35% |
| Indicative meals served per academic day | 3,938 |
| Indicative food waste per served meal | 75 g |
| Indicative food waste per academic day | 295.3 kg |
| Academic days used for monthly planning | 22 |
| Indicative monthly baseline | 6,496.9 kg / 6.50 t |
5. Indicative Outlet-Level Distribution
The following table distributes the planning baseline across the five food-service points according to their indicative share of daily food-service demand.
These figures are planning estimates and are replaced by actual measured values in daily and monthly monitoring records.
| Food-Service Point | Share | Meals / Day | Waste / Day (kg) | Month (kg) | 10% Target / Day (kg) | 10% Target / Month (kg) |
|---|---|---|---|---|---|---|
| Master Food | 30% | 1,181 | 88.6 | 1,949.1 | 79.7 | 1,754.2 |
| Milliy taomlar | 22% | 866 | 65.0 | 1,429.3 | 58.5 | 1,286.4 |
| Talabalar kafesi | 20% | 788 | 59.1 | 1,299.4 | 53.2 | 1,169.4 |
| Student Cafe | 15% | 591 | 44.3 | 974.5 | 39.9 | 877.1 |
| NUR Restaurant | 13% | 512 | 38.4 | 844.6 | 34.6 | 760.1 |
| TOTAL | 100% | 3,938 | 295.3 | 6,496.9 | 265.8 | 5,847.2 |
6. Food-Waste Reduction Target
The initial operational target is to reduce avoidable food waste by 10% relative to the indicative planning baseline while maintaining adequate food-service provision.
This corresponds to a target level of approximately 265.8 kg per academic day or 5.85 tonnes over a 22-day academic month.
The reduction target is intended to be achieved through measured operational improvements rather than by restricting access to food.
| Stage | Daily Level (kg) | 22-Day Month (t) | Status |
|---|---|---|---|
| Indicative planning baseline | 295.3 | 6.50 | Planning reference |
| Initial reduction target (-5%) | 280.5 | 6.17 | Short-term target |
| Operational reduction target (-10%) | 265.8 | 5.85 | Programme target |
| Stretch reduction target (-15%) | 251.0 | 5.52 | Longer-term target |
Daily Food-Waste Reduction Targets
7. Measurement Procedure
The institutional measurement procedure consists of six interconnected stages.
Food leftovers and preparation waste are collected separately from general waste in designated containers.
Collected food waste is weighed in kilograms using a functioning digital scale.
The date, outlet, measured weight and responsible person are entered in the daily monitoring log.
Daily measurements are summed by outlet and transferred to a monthly monitoring summary.
The responsible unit checks outlet reports for completeness and internal consistency.
Measured results are used to identify high-waste meals, excessive portions and other avoidable losses.
Food-Waste Separation and Monitoring
Source-separated food waste is collected and recorded at the relevant food-service point. The monitoring process is supported by daily measurement logs and monthly summaries.
Figures 2–3. Source separation and food-scrap collection processes are documented in the Institute's earlier food-waste evidence materials.
8. Monitoring Indicators
| Indicator | Institutional Position | Monitoring Frequency |
|---|---|---|
| Identified food-service points | 5 | Reviewed when service structure changes |
| Food-service points in monitoring scope | 5 | Continuous |
| Coverage of identified food-service points | 100% | Continuous |
| Measurement unit | Kilograms | Daily |
| Outlet-level records | 5 separate outlet records | Daily |
| Institutional consolidation | One combined monitoring summary | Monthly |
| Reduction target | 10% relative to planning baseline | Reviewed monthly |
| Public / institutional reporting | Summary of verified results | Periodic |
9. Data Quality Rules
The institutional monitoring system applies clear data-quality requirements to improve the reliability, traceability and consistency of food-waste information.
- Measured values take precedence over planning estimates.
- Planning estimates are clearly identified and are not presented as measured results.
- Missing measurement days are recorded as missing rather than back-filled with assumed values.
- Monthly outlet totals must be traceable to daily logs.
- The institution-wide total is calculated only from verified outlet-level measurements.
- Food waste is measured before subsequent treatment, transfer or disposal.
- External operators, where applicable, provide outlet-level measured records for institutional consolidation.
10. Operational Response and Expected Improvement
The monitoring system is designed to move the Institute from broad waste-management awareness toward more precise outlet-level management.
The key improvement is the ability to identify where food waste is generated, compare food-service points and introduce targeted corrective actions.
Portion Optimisation
Introduce smaller or flexible portions where plate waste is consistently high.
Menu Review
Review meals that repeatedly generate larger quantities of leftovers.
Preparation Planning
Adjust food preparation quantities where overproduction is identified.
Awareness Activities
Encourage students to take only the amount of food they expect to consume.
Monthly Feedback
Provide regular feedback to food-service personnel using verified measured results.
Performance Comparison
Periodically compare measured results against the 10% reduction target.
11. Post-Measurement Handling and Waste Diversion
After weighing and recording, separately collected food waste is transferred through the Institute's verified handling route.
Where organic treatment or composting is applied, this stage is documented separately from the measurement record so that the amount generated and the amount subsequently treated remain distinguishable.
Food-Waste Management Process
Collection
Food waste is collected separately at designated food-service points.
Measurement
Collected food waste is weighed and recorded in kilograms.
Transfer and Handling
Recorded waste is transferred through the verified handling route.
Waste Diversion
Any applicable organic treatment or composting is documented separately.
12. Institutional Reporting
Measured food-waste results are consolidated with supporting records such as outlet logs, monthly summaries and photographs.
This provides a transparent basis for internal sustainability reporting and enables the Institute to demonstrate continuous improvement in food-waste management.
Supporting Monitoring Documentation
Daily Monitoring Logs
Records of measured food-waste quantities for individual food-service points.
Monthly Monitoring Summaries
Verified monthly totals and institutional consolidation records.
Photographic Documentation
Visual evidence of food-service facilities and waste-handling practices.
Operational Improvement Records
Documentation of corrective actions, follow-up measures and periodic reviews.
Selected Benchmarking References
- University of Notre Dame – Campus Sustainability: LeanPath food-waste tracking and weighing programme.
- University of Minnesota – Office of Sustainability: Campus-wide food-waste weighing used to identify and reduce waste.
- Stony Brook University – Office of Sustainability: Weigh the Waste programme based on direct weighing of dining-hall food waste.